Introducing the Moneris Event Impact Analysis Report
Moneris’ Event Impact Analysis (EIA) Report provides actionable insights to improve future event planning and strategy for organizations. Using detailed consumer spending data, EIA Reports can help businesses and public sector agencies understand the success and economic impact of their events and projects. By analyzing real-time payment information, your business can gain insights into consumer spending patterns before, during, and after event activities.For example, a city government hosting a music festival can use this data to see how much attendees spend at local businesses during the event, and if there was residual economic impact after the event. Similarly, say your company is organizing a product launch. You can assess if the event leads to increased sales. This can help you decide how and where to invest your money in future events, evaluate if you need an increased budget for future iterations, or even if a shift in your approach is necessary.
The EIA Report leverages cutting-edge technology and advanced data analytics to provide unparalleled insights into the economic footprint of events. You’ll get a comprehensive view of consumer spending patterns, enabling your organization to precisely measure the incremental impact of your events on local economies.
With the EIA report you get a detailed analysis in two key areas – the Event Performance Report and the Event Lift Curve Report – which assess the effectiveness of an event so that you can make informed decisions for future planning.
Event Performance Report:
The Event Performance Report provides detailed insights into the financial impact of a specific event. It delves into various metrics such as:• Total spending on the event day
• Incremental net spend attributed to the event
• The percentage increase in spending directly linked to the event
By examining these metrics, businesses can gauge the success of their events and evaluate their return on investment.
Event Lift Curve Report:
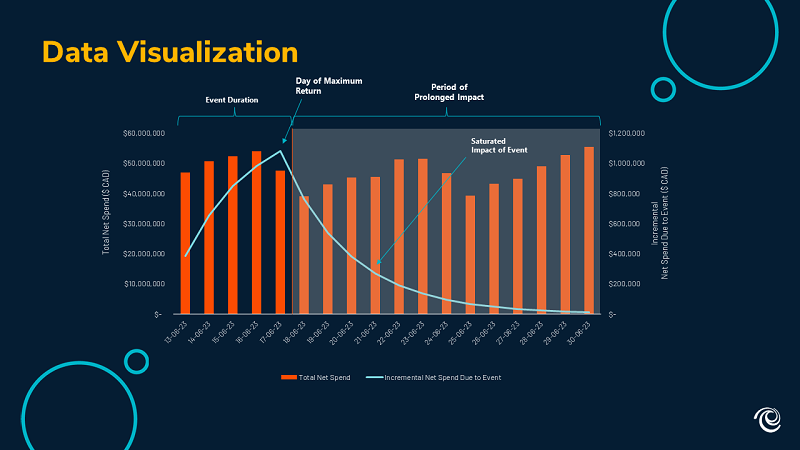
Complementing the Event Performance Report is the Event Lift Curve Report, which offers a visual representation of how an event influences spending patterns over time. This report illustrates:
• The trajectory of spending
• Pinpoints the day of maximum impact
• Indicates when the event's influence on spending begins to level off
By visually mapping out these trends, organizations can identify the optimal timing for future events and better understand consumer behavior dynamics surrounding their initiatives.
Moneris has an extensive processing network and talented data science experts who conduct analysis using robust data sets and sophisticated statistical modeling. With the large amount of data at Moneris’ disposal and a dedicated Data Services team to analyze this data, businesses, and organizations have a ready-to-consume product that bridges the gaps they have.
Value of the Event Impact Analysis Report
Our reports are designed to clearly and concisely illustrate the impact of an event. Users don't need to be experts in technical or mathematical fields to understand them. They can easily extract actionable insights from the results.
By leveraging Moneris' expansive processing network, our reports offer a comprehensive and accurate depiction of the events' impact on the area.
Additionally, Moneris can enhance the report's value by adding customized supplementary dimensions or incorporating additional data. This could include customer origin locations, distinguishing between new and repeat customers, and providing more detailed transaction data.
Dig Deeper with Historical Spending Data
Moneris EIA reports use multivariate regression models to analyze the relationship between multiple independent variables (factors) and a single dependent variable (outcome). These statistical tools help researchers understand how changes in one or more variables affect the outcome of interest.For example, in the context of assessing the economic impact of an event, multivariate regression models might consider factors like seasonality, regional spending trends, and macroeconomic indicators like inflation to predict how much money people may spend during and after the event.
In addition to multivariate regression models, Moneris employs further statistical analysis and theory to assess the extended impact of an event even after it has concluded.
To learn more or to request a demo of the Moneris Event Impact Analysis Report, visit Moneris Data Services.
Share